As more and more companies tend to adopt the DevOps trend in their software development process, DevOps has slowly become a set of practices rather than a concept.
It is about finding a smooth interaction between development and operations in order to overcome the frequent conflicts that we can face in every software delivery industry.
One of the DevOps Ecosystem landing tools is Docker. This open-source emerging technology aims to easily pack, ship, and run any application as a lightweight, portable, self-sufficient container, which can run virtually anywhere.

With the explosion of the Docker container market, almost all IT and cloud companies have adopted docker technology.
Researchers have proven that Enterprises are packing in 50% more containers per host in 2018 as compared to 2017, according to the 2018 Docker Usage Report by container monitoring company Sysdig.
Docker is dominating the container runtime, used by 83% of all the containers in production, and in order to manage this increasing number, we have to face the challenge of keeping an eye close to understand what is really happening inside our container. Monitoring containers are one of the most challenging activities related to container-based applications.
In front of this high scale of containers, we can see an increased need to understand what is really happening inside the containerized application.
Monitoring comes as a primordial step towards optimizing and boosting the performance of containers running in different environments.
What is monitoring
The essence of Monitoring philosophy is to ensure that a running program or process is performing to the expected level.
It is a systematic review process aiming to observe and check the quality and progress of such an application over a period of time.
In fact, the Open Source community offers a ton of tools to monitor Docker and to ensure that these plenty of containerized applications are performing as expected.
When talking about docker monitoring tools, we do focus on processes and their evolutions. It is about collecting and analyzing information and metrics to track the containerized application progress toward reaching its objectives. This Dashboard interface is going to be a guide to the management decision, to evaluate and to track applications ‘performance.
 Note: Monitoring VS orchestration
In order not to confuse monitoring and orchestration as basic concepts related to the container’s lifecycle we should clarify that Orchestration tools are defined to provide a specific layer added to the containers toolchain to ensure their deployment, availability scaling, and networking.
Why do we need to monitor our docker containers?
It is obvious that monitoring is an essential part of Docker-based environments.
The main points that we are going to highlight are:
- Detecting issues and troubles at an early stage to avoid risks at a production level
- Changes and upgrades can be done safely as the whole environment is tracked
- Refine applications for better performance and robustness
What are the best tools to monitor our containers
In this article, we have decided to round up the most useful docker monitoring tools. Below we have tried to define a rich list of these existing tools.
The Open Source community offers a ton of tools to monitor our docker containers.
1. Docker API (Docker Stats)
![]() Let’s start with a simple monitoring tool provided by Docker itself, as an API already included in the Docker engine client which is docker stats command line.
Let’s start with a simple monitoring tool provided by Docker itself, as an API already included in the Docker engine client which is docker stats command line.
Docker stats provides an overview of some metrics we need to collect to ensure the basic monitoring function of Docker containers. This API gives us an access to CPU usage, memory, networking information and disk utilization for a running Docker container.
It is about displaying a live stream of a container(s) resource usage statistics.
To see statistics related to a running Docker container, we can simply run docker stats with the desired options, associated with the name of the container.
If there is no specified name, docker stats per default shows all the existent containers and its statistics.
To use docker stats we simply write on the command line:
docker stats [OPTIONS] [CONTAINER…]
The execution of this command will show us this output:
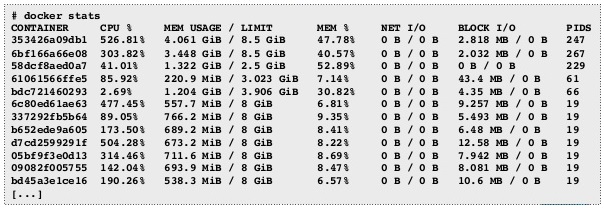
We can use many options with docker stats command line.
Docker stats shows the percentage of CPU utilization for each container, the memory used and total memory available to the container. Added to that we can see total data sent and received over the network by the container.
Actually, Docker stats is a quick data stream, that shows you a detailed overview of important parameters related to your Docker container automatically. It is really useful, as you can use it at any given moment. But we have to mention that the shown data, is not stored at any place, so this is about an instant capture related to the actual status of the container. For that reason, we cannot talk about tracking with docker stats as a monitoring tool, as we cannot review these metrics and understand what is really happening with our containerized application.
To Sum Up with docker stats tool, it is an open-source API deployed in the docker demon itself, offering a detailed statics and metrics of containers automatically when running the command line which is useful in many cases, but we don’t talk about any level of aggregation with this tool, or any ability to raise alarms or track the performance of the running application inside the docker container.
Verdict: already deployed with docker daemon, quick to use, basic metrics and statics, no capacity to send alerts
Official website: docker docs
Availability: Open Source API
2. cAdvisor
 cAdvisor is another monitoring tool for Docker containers, offered by Google and having native support for Docker containers. It consists of a single shipped container, that you can run and access via a graphical interface showing the attached statics of our dockized application.
This container can collect, process, aggregate and export information related to the running containers.
In order to get up and run cAdvisor, we have just to run the command below and expose the web interface on port 8080, which is the graphical overview of the docker stats-all command.
docker run\
--volume=/:/rootfs:ro\
--volume=/var/run:/var/run:rw \
--volume=/sys:/sys:ro \
--volume=/var/lib/docker/:/var/lib/docker:ro \
--publish=8080:8080 \  --detach=true \
--name=cadvisor \
google/cadvisor:latest
Once launched, we can access the graphical interface, via typing this
http://localhost:8080/ in a browser. cAdvisor will connect itself directly to the Docker daemon running on our host machine so we can start visualizing the related metrics of the running container, including cAdvisor too as a single container.cAdvisor displays the graphs related to the CPU usage, Memory usage, Network input/output and disk space utilization. The figure below illustrates an overview of the dashboard displayed by cAdvisor.
One of the most important tasks in the monitoring is the graphical part, cAdvisor is a very useful tool that it can be set up in an easy way to discover the resources consumption by the containerized applications.
Another plus for cAdvisor is that we can integrate it easily in our environment, as it is an open-source tool supporting docker features, giving us a quick overview of our running application. This information is invaluable if we need to know when the additional resources are needed for our cluster for example.
However, it has its limitations, with cAdvisor we talk about metrics related to one single container. If we have more than one docker host, it is going to be difficult for the cAdvisor to monitor these nodes. Also, the data visualized concerns o capture the running processors during one-minute so we cannot talk about a long-term monitoring concept.
Sending alerts if one of our resources is at a dangerous level is critical, but not provided by cAdvisor so we do not have global visibility.
We have to note, that there are other monitoring tools based on cAdvisor. For example, Rancher is integrating cAdvisor for every connected host and exposes the stats through its UI.
Verdict: graphical dashboard for metrics and statics, support docker API, no capacity to send alerts
Official website: cAdvisor
Availability: Open Source tool
3. Scout
![]() As an improvement to cAdvisor, Scout comes with a hosted monitoring service that has the capacity to aggregate metrics from many hosts and containers and it is able to present the data over longer time-scales. In addition to that Alerts can be created based on the result of these metrics.
As an improvement to cAdvisor, Scout comes with a hosted monitoring service that has the capacity to aggregate metrics from many hosts and containers and it is able to present the data over longer time-scales. In addition to that Alerts can be created based on the result of these metrics.
Scout is not an open-source tool, we have to be signed in the scoutapp.com site and a free trial version is up for 14 days, which will offer us the opportunity to test out its integration.
Other points are handled by Scout tool which is the following:
- Reporting metrics related to CPU Usage, Memory limit, and usage, Network usage, Number of containers running …
- Sending Alerts based on capacity and performance issues
- Identifying if background jobs take too much in the queue
- Comparing performance between different deployments
The picture below illustrates a global overview of the Docker Scout Dashboard.
Based on this dashboard we can remark that comparing the performance of our application is easily handled, between different time periods we can analyze the performance of a specific metric selected via a drop-down list and view the graphical diagram.

It is obvious that Scout is a powerful tool to monitor docker containers in a very attractive designed UI and ease of install and management.
Although all these attractive points of Scout, we have to note also that one drawback of Scout is that we can get detailed information related to a specific container on each host like cAdvisor. This could be problematic in some cases, while monitoring we need to get in detail if there are any issues, or abnormal processing for a specified application especially if we are running multiple containers on the same server.
Added to that, Scout has a price, which is almost 10 dollars per monitored host, and this could be a problem if we are running a large number of hosts.
Verdict: powerful tool, attractive design, ease of install and management, not an open-source tool
Official website: Scout
Availability: 10 USD per Host
4. Data Dog
![]() Another powerful tool to monitor docker containers is DataDog. It is full-stack cloud-based monitoring and alerting service designed for IT operations and development teams. It can monitor container environments easily thanks to its containerized environments.
Another powerful tool to monitor docker containers is DataDog. It is full-stack cloud-based monitoring and alerting service designed for IT operations and development teams. It can monitor container environments easily thanks to its containerized environments.
The Data Dog system can be integrated with many applications and tools, and docker is one of them.
Datadog addresses many drawbacks of Scout and cAdvisor. It focuses on providing very detailed metrics of the whole running applications.
All the monitored points are arranged in an elegantly designed dashboard that can be customized based on our needs and properties. Notifications also are triggered depending on the issues and severity.
One of the powerpoint to highlight with Datadog is the capability to highlight any follow-up that occurred, so we can avoid it and get annotated about it in the future.
When running the Datadog agent in our host, based on the command given by the Datadog website, the launched agent will start reporting metrics to the Datadog system. The full Access API of Datadog system has the ability to capture events and analyze them via graphical diagrams in the dashboard view, alerts and also collaboration tools as is illustrated in the figure below.
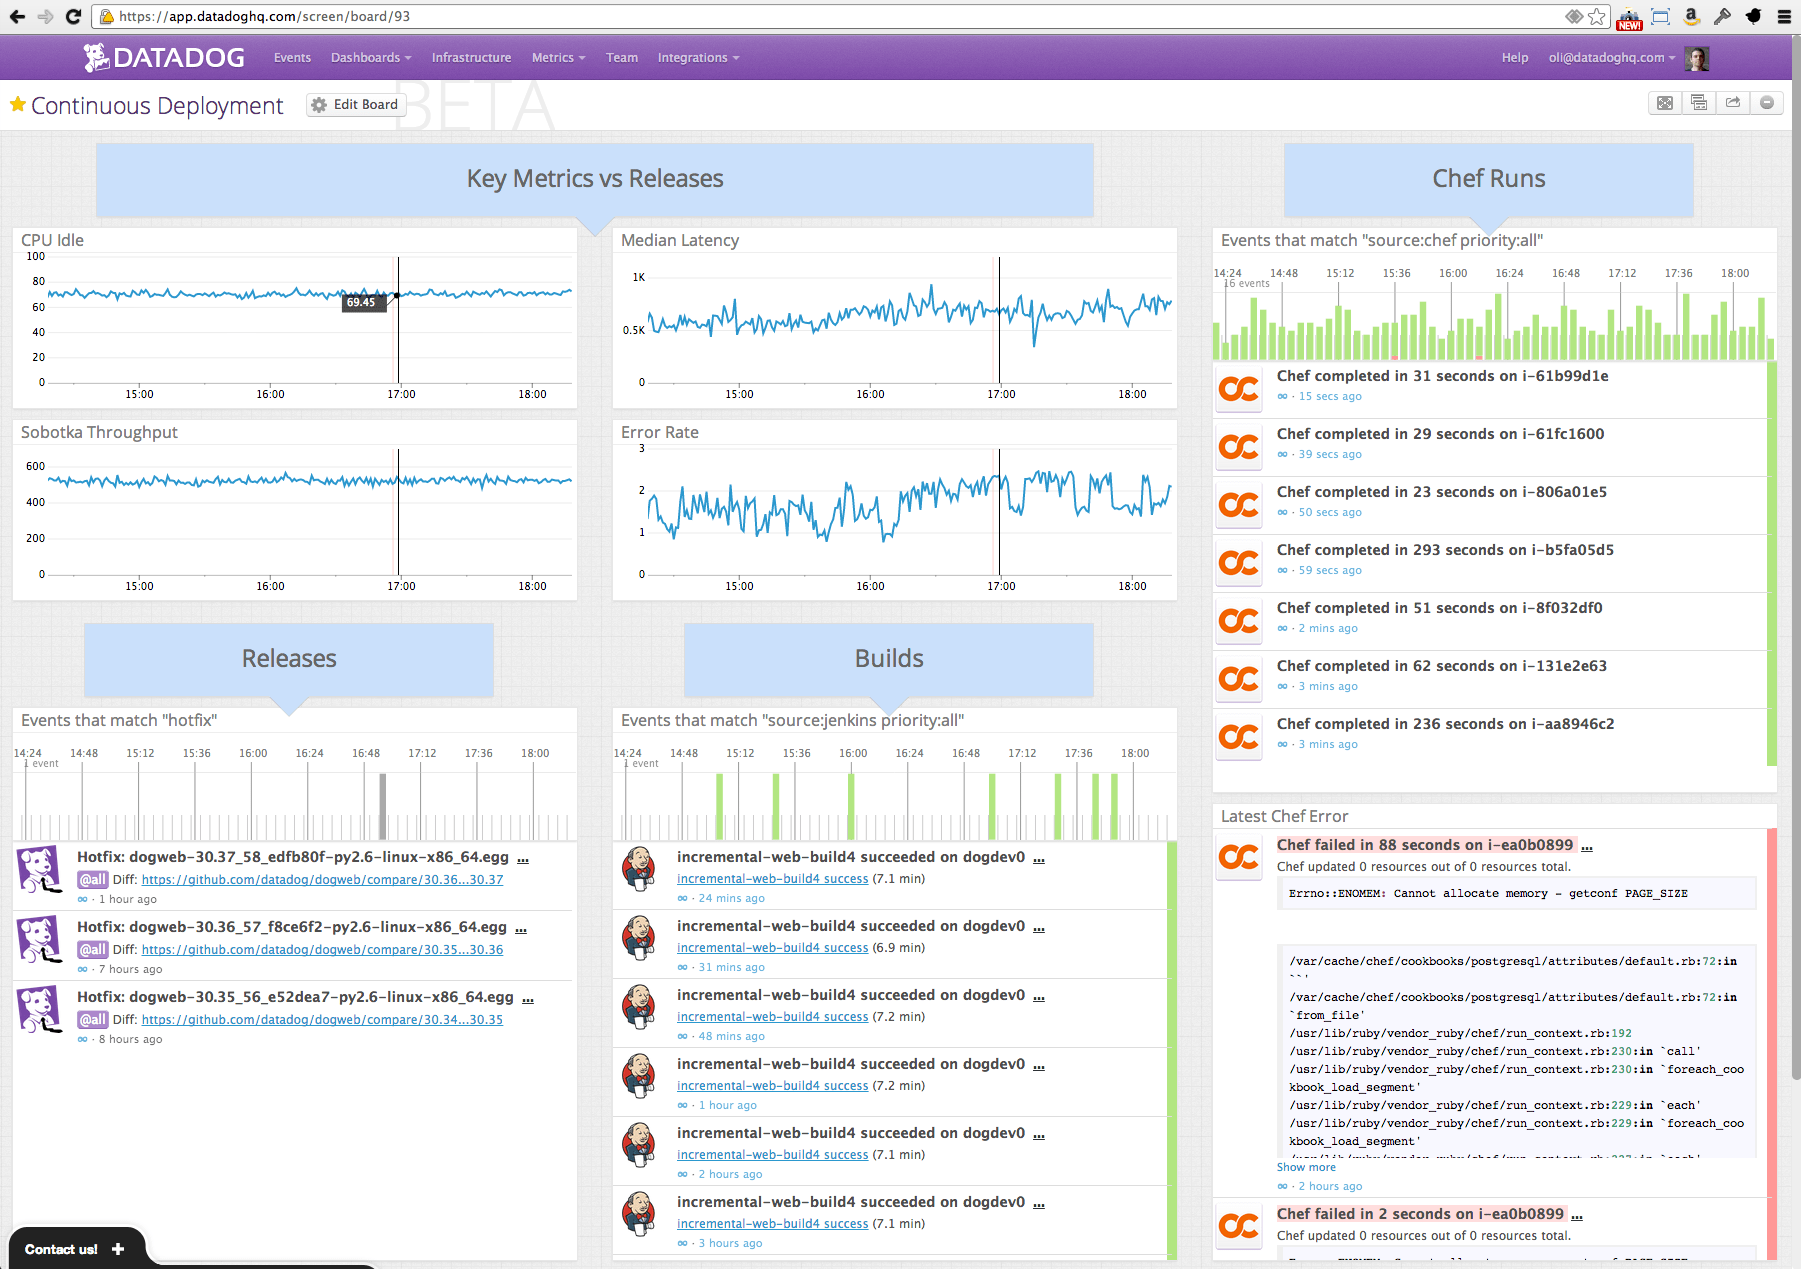
This dashboard overview reflects the granular way of how Datadog functions. Datadog shows the personalized key metrics, the build history, the running events…
Using Datadog we can specify how to create alerts, as this tool supports alerting based on a feature called Monitors. It is equivalent to Scout trigger and it allows you to define the composition of your alert events.
All these features lead us to the conclusion that Datadog is a real powerful cloud tool, that has shown significant improvement to all the monitoring tools mentioned above, with a very user-friendly design, a rich set of supported tools and systems (docker and non-docker resources), and it’s easy to use. However, these advanced functionalities come with a higher cost equal to 15 dollars per agent.
Verdict: cloud solution, user-friendly design, a rich set of supported tools and systems, easy to use, alerts raising
Official website: DataDog
Availability: 15 USD per Agent
5. Prometheus
 Another important monitoring tool for Docker containers is Prometheus. It is an open-source toolkit used for monitoring and alerting. Prometheus can be used to monitor computer systems and alert sysadmins about the health of our environment.
To understand how Prometheus work we have to look at it as a self-hosted set of tools that provide metrics storage, visualization, alerting and aggregation.
We call these metrics providers: Exporters. There are also libraries that can be used to create custom exporter.
When it comes to Docker, Prometheus needs a container exporter that will capture metrics and collect data, so that it can be analyzed later. Whenever our exporters are running, we can launch the Prometheus server based on a configuration file that tells the server from where the metrics can be scrapped.
Once the metric endpoints are integrated into their time-series database, the rest of the Prometheus monitoring toolset can be used to observe metrics and raise alerts if something is underperforming. Related metrics and graphs are displayed in a UI dashboard based on the Grafana toolkit as it is illustrated in the figure below.

One of the important points to mention with Prometheus is the ability to raise alerts based on the applied alerting rules over the input data and to display the alerts on the UI. This alerting process will be more useful when sending an email or notifying a pager duty to manage business-impacting incidents. All of this can be done via running the Alert manager, and via creating related configuration files at the first stage.
It is Obvious that Prometheus uses simplified format for input data and can be integrated with any web endpoint to scrape the data from. there are also several libraries defined to monitor common resources. What Prometheus lacks the most is the ease of deployment. We have to manage the configuration files for every container so they can support the Prometheus server.
In addition to that, the fact that all components are dockized is a major plus, however, we had to launch 4 different containers, each with their own configuration files to support the Prometheus server. The project is also lacking detailed, comprehensive documentation of these various components.
So, if we are comparing this monitoring tool to the other ones, we will conclude that Prometheus is a powerful tool, with a competitive UI and high analytical capabilities that necessitates an additional effort for deploying it and configuring its files.
Verdict: Competitive UI, high analytical capabilities, capacity to raise alerts, high level of aggregation, non-ease of deployment, support non-docker resources.
Official website: Prometheus
Availability: Free
6. Sysdig
 Sysdig as a Docker monitoring tool has per objective to get proper visibility of what is happening inside our containers.
It is based on transparent instrumentation to aggregate metrics from Docker containers in real-time in order to provide meaningful dashboards and alerts related to the running applications.
It is a hosted service, that works differently compared to the other tools we have been talking about. The idea is using an agent related to Sysdig, that sits at the operating system level instead of installing an agent on every docker container. This agent understands the processes that are running in the system and the services running in a container. We are talking about container-native monitoring, which is displayed in Sysdig dashboards as arrays coverings CPU usage, memory consumption, network usage, File I.O, and other Performance metrics.
We should be logged into the Sysdig portal, to get a trial version. When running the Docker containers in our hosts, they will appear in the console of Sysdig too. We can select any host, or a container so that we can see its proper metrics and dashboards.
Another option offered by Sysdig is live metrics. We can control our containers in real-time thanks to real-time mode. We can define comparisons between 2 different moments, to evaluate the application’s performance as well.
The Sysdig supports very detailed alerting criteria, and presents a very useful UI to manage these alerts, and define its rules.
The figure below illustrates an overview of the Sysdig dashboard.
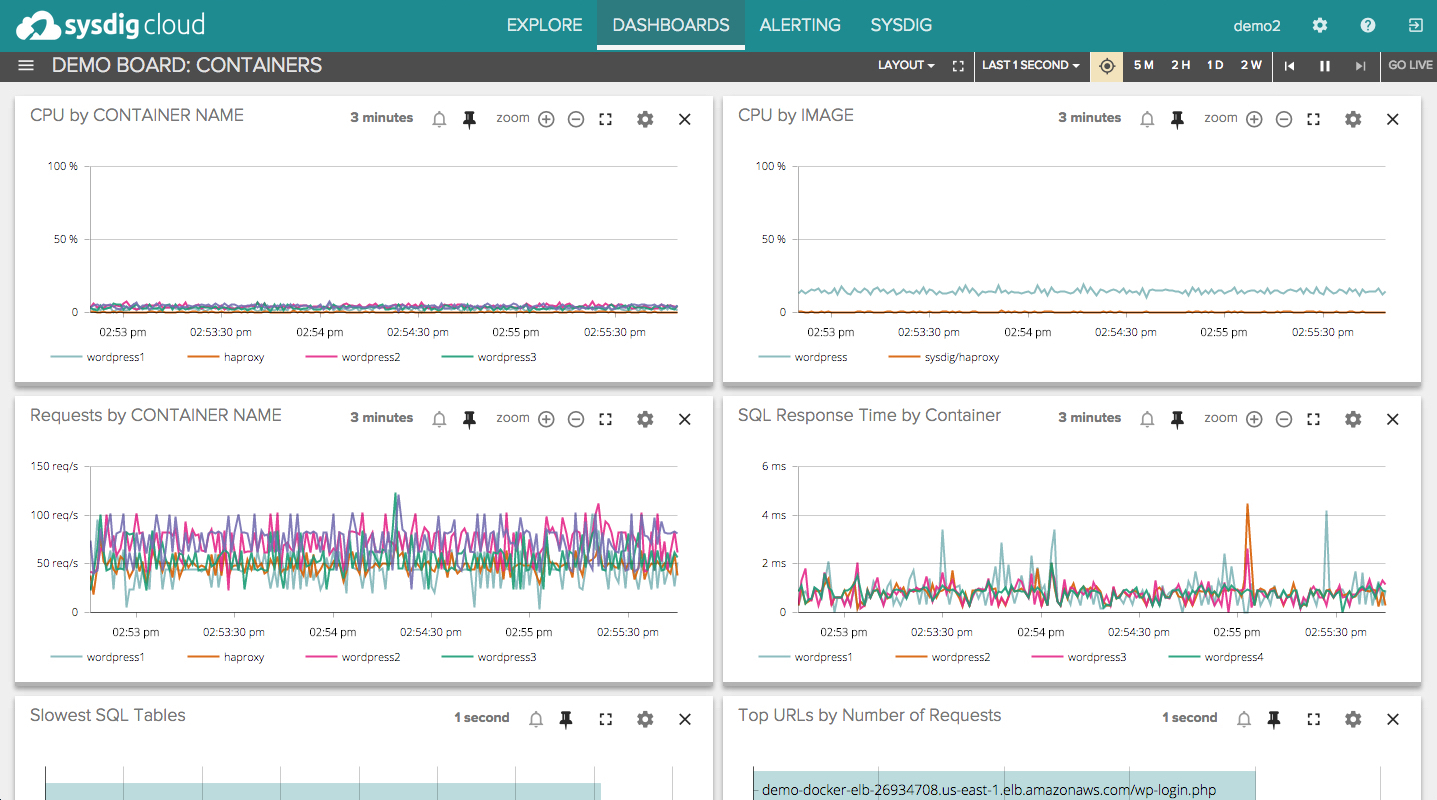
All things considered, we have to mention that Sysdig is a very user-friendly tool to monitor docker containers, as it offers an ease of deployment. We can set up the Sysdig agent easily. Moreover, it shows very detailed dashboards with a real-time tracking option. The alert system is very well managed by Sysdig.
We have to note that this toolset is not for a free price, we have to pay 20 dollars per hots to get the benefices of this large list of options. Reviewing the price, we will notice that Sysdig is a serious competitor for the Data Dog tool.
Verdict: Cloud solution, easy to set up, detailed metrics, great visualization tools for real-time and historical data, medium ease of deployment, support non-docker resources.
Official website: Sysdig
Availability: 20 USD per Host
7. Sensu monitoring framework
![]() Sensu is more than a simple monitoring tool It is a comprehensive tool that is powerful enough to provide monitoring solutions for complex environments.
Sensu is more than a simple monitoring tool It is a comprehensive tool that is powerful enough to provide monitoring solutions for complex environments.
But also simple enough to be used with traditional ones.
With Scout and Datadog we talk about centralized monitoring and alerting, however with Sensu it is about a self-hosted and centralized metric s service.
To run Sensu with Docker containers, there is an image at the Docker Hub containing the basic API of the Sensu server so we can run it as a single container on our host.
And in order to support docker container metrics and status checks, we have to use a plugin system.
Based on configurations and scripts, we can refine our evaluation criteria with Sensu. We have the ability to collect details about our docker containers, aggregate the value on our single storage place, and raise some alerts based on these checks.
Comparing this framework with other monitoring tools, we will find ourselves in front of a tough job to be done for the deployment of this framework. In order to Deploy Sensu, we need to automate so many steps in order to launch complement processes that Sensu works with such as Redis, RabitMQ, Sensu API, Uchiwa and Sensu Core.
Furthermore, we still need to use a graphical tool that integrates with Sensu to display these metrics such us: Graphite.
From the perspective of Alerts, Sensu is also offering a basic alerting system, that refers to checks failing on individual hosts. And if we want to create more checks, we need to restart the Sensu server so that new metrics can be tracked and that we can collect them.
For all these reasons, Sensu comes in fairly low competition with the other monitoring tools, despite being free cost tool, and its ability to monitor non-docker resources.
Verdict: Framework, high level of aggregation, ability to raise alerts, limited Ability to monitor non-docker resources
Official website: Sensu
Availability: Free
8. Sematext
![]() Let’s move on to another monitoring tool which is Sematext.
Let’s move on to another monitoring tool which is Sematext.
It is a Docker-native monitoring and logging solution that collects and processes infrastructure and application performance. It tracks docker metrics, events, and logs for all auto-discovered container and cluster nodes. This powerful tool has its own log management solution and provides very high-performance monitoring and even faster troubleshooting.
The following image illustrates a global overview, of the Sematext dashboard.

Sematext has a single agent that captures logs, metrics, and events for all containers and their hosts automatically. It runs as a single container on every Docker host, in order to provide processing and automatic collection of Docker metrics. Added to that it provides full-stack visibility so the business user can extract value and decide based on performance.
Sematext supports a lot of tools and cloud platforms such as docker swarm, docker cloud, docker datacenter, Amazon EC2, Kubernetes, Mesos, RancherOs, Google container …
Obviously, we cannot deny that Sematext brings real-time performance monitoring capacity, log management, events, and alerts… Being a powerful tool that provides visibility of our dynamic infrastructure comes with a cost.
Verdict: real-time performance, log management solution, performance monitoring service, support a lot of tools,
Official website: Sematext
Availability: depends on data transfer rates per day (example the standard package is for 50 USD per month)
 Let’s Summarize
 Let’s Summarize
Regarding all this variety of tools, we can see that every single feature in each tool,
Before choosing a specific tool, we have to take in consideration the time aspect: time to handle these tools, to deploy them, to maintain and to stay up-to-date with their new features, and capabilities.
Conclusion
There are plenty of tools to monitor our docker containers. Making a refined choice from this variety of tools is always up to the needs and metrics we need to supervise and to the combination of the existing DevOps toolchain used in our infrastructure. The objective is to keep an open eye to what is going inside these containers in order to optimize our applications and systems.
Monitoring philosophy itself is very sensitive, and when it comes to docker environments it becomes even more challenging, simply because every container runs its own environments, processes, variables, has its virtual network, and storage configuration.
In this article we have tried to cover the most popular tools on the market, mixing open source solutions with paid tools and platforms.
We can definitely make a comparison based on some metrics, UI, cost, and performance between these tools, but choosing the best monitoring solution depends on the combination of tools that we have, our challenges and our needs.
The objective is to identify which metrics we need to monitor, how to define the rules and levels of our alerts, visualize dependencies, and ensure high availability without sacrificing performance.
Docker Ecosystem is increasingly growing throughout the software development industry, so the companies need to be aware of how much being able to monitor our systems is crucial for boosting the performance of their applications.
Thanks for this article, it’ interesting.
I have good experience with portainer and it’s free
Thanks